
Population Ecology
Growth models and population structure.
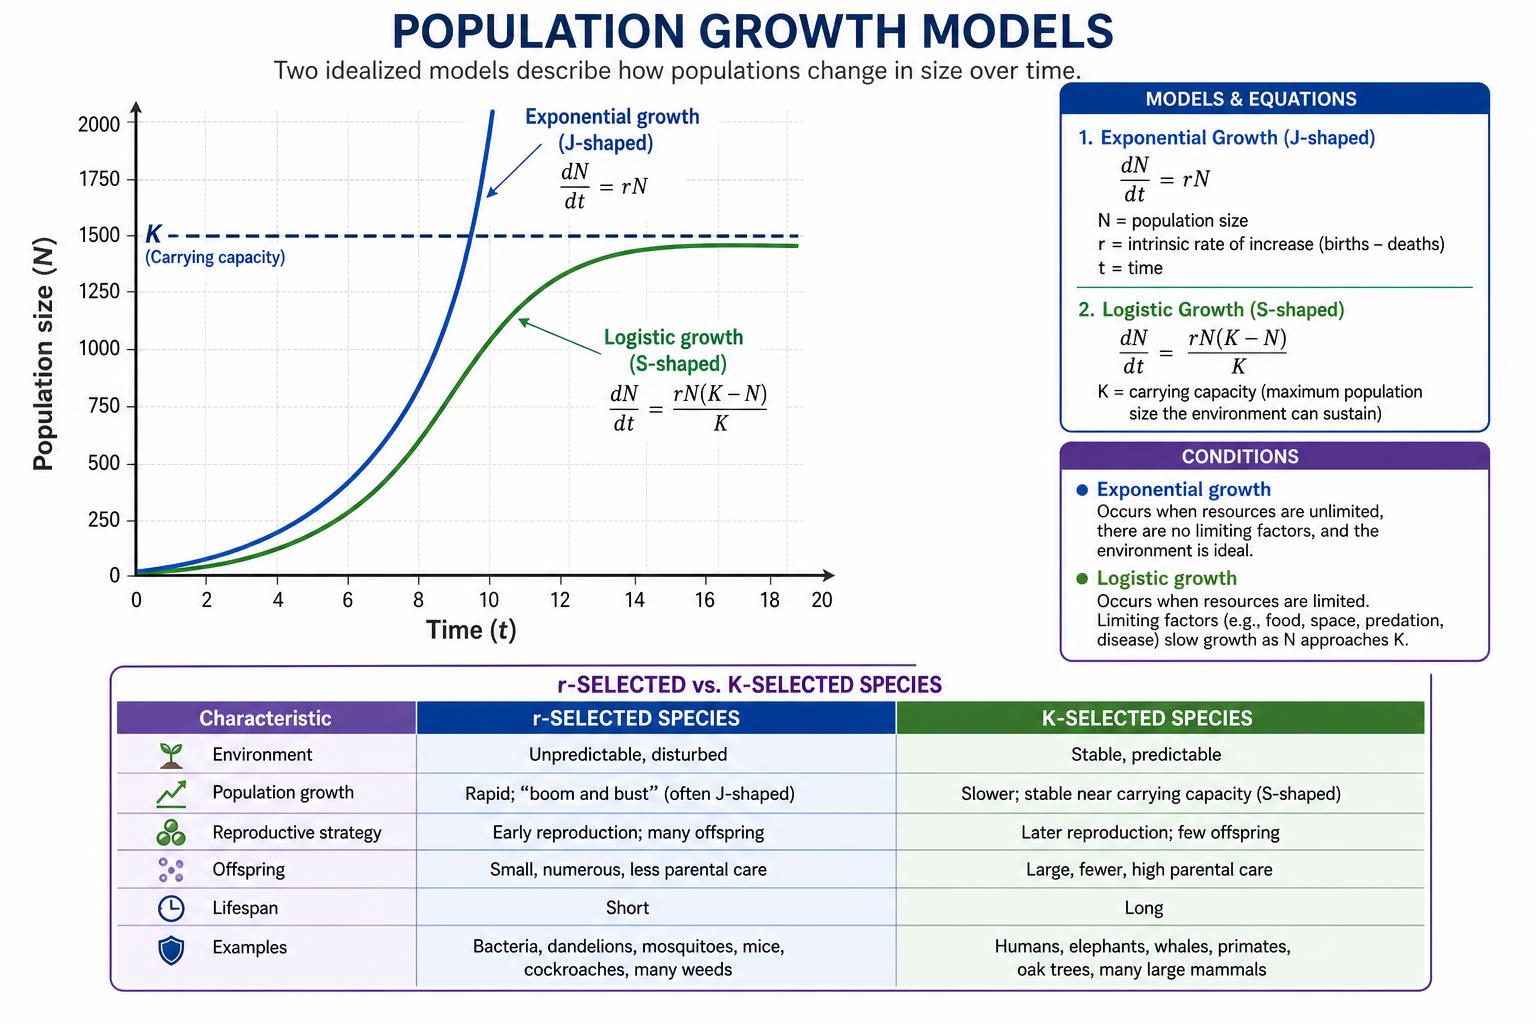
Exponential growth
Under unlimited resources, populations grow exponentially: dN/dt = rN, where N is population size and r is the per-capita rate of increase. The graph is a J-shaped curve that gets steeper and steeper.
This is rare in nature and never lasts long — eventually some resource runs short (food, water, space). When bacteria are introduced to a fresh nutrient flask or invasive species colonize a new area without predators, you can see exponential growth briefly.
Logistic growth & carrying capacity
More realistic: dN/dt = rN(K – N)/K. K is the carrying capacity — the maximum population size the environment can sustain. As N approaches K, the (K – N)/K term shrinks toward zero and growth slows. The resulting S-shaped (sigmoidal) curve levels off at K.
Density-dependent vs. density-independent factors
- Density-dependent factors get stronger as population density increases: competition for food and mates, disease and parasites (spread easier when crowded), predation, accumulating waste. These regulate populations near K.
- Density-independent factors hit regardless of density: weather extremes, fire, floods, volcanic eruptions, sudden habitat destruction.
Life-history strategies: r vs. K
r-selected species (many insects, weeds, bacteria): high r, many small offspring, little or no parental care, short lifespan, early maturity. Thrives in unstable or new environments.
K-selected species (elephants, whales, humans): low r, few large offspring, lots of parental care, long lifespan, late maturity. Wins in stable environments near carrying capacity.
Age structure & survivorship
Age-structure diagrams plot the number of individuals in each age class. A wide base (lots of young) signals future growth; an even distribution suggests stability; a narrow base predicts decline.
Survivorship curves come in three types: Type I (high survival until old age — humans), Type II (constant mortality at every age — many birds), Type III (high early mortality, then high survival for survivors — most fish, oysters, many plants).
Key terms
Quick definitions to lock in before the exam.